1. "edebug" vs "debug"
There is a difference between edebug and plain-old debug. See: https://www.math.utah.edu/docs/info/emacs-lisp-intro_18.html
TL;DR: Edebug is probably what you want.
2. Basics
To instrument a function for debugging, evaluate it via C-u C-M-x. When you're done, remove instrumentation by re-evaluateing it with the usual C-M-x
3. Edebug commands
| C-u C-M-x | launch debugger |
| b | set breakpoint |
| u | unset breakpoint |
| g | continue until next breakpoint |
| w | Show current position |
| e | eval someting |
| M-: | Evaluate something (in local scope) |
What edebug seems to lack is an easy way to inspect variables. Here's some code I found which attempts to address this, although it doesn't work well for complex local variables.
(use-package edebug
  :init
  ;; A quicker alternative to E for inspecting local variables in Edebug
  ;; Not extensively tested
  (define-key edebug-mode-map "A" 'nate/elisp-add-to-watch)
  (defun nate/elisp-add-to-watch (&optional region-start region-end)
    "Add the current variable to the *EDebug* window"
    (interactive "r")
    (let ((statement
           (if (and region-start region-end (use-region-p))
               (buffer-substring region-start region-end)
             (symbol-name (elisp--current-symbol)))))
      ;; open eval buffer
      (edebug-visit-eval-list)
      ;; jump to the end of it and add a newline
      (goto-char (point-max))
      (newline)
      ;; insert the variable
      (insert statement)
      ;; update the list
      (edebug-update-eval-list)
      ;; jump back to where we were
      (edebug-where))))
I generally don't use this as M-: is good enough.
4. Backtraces
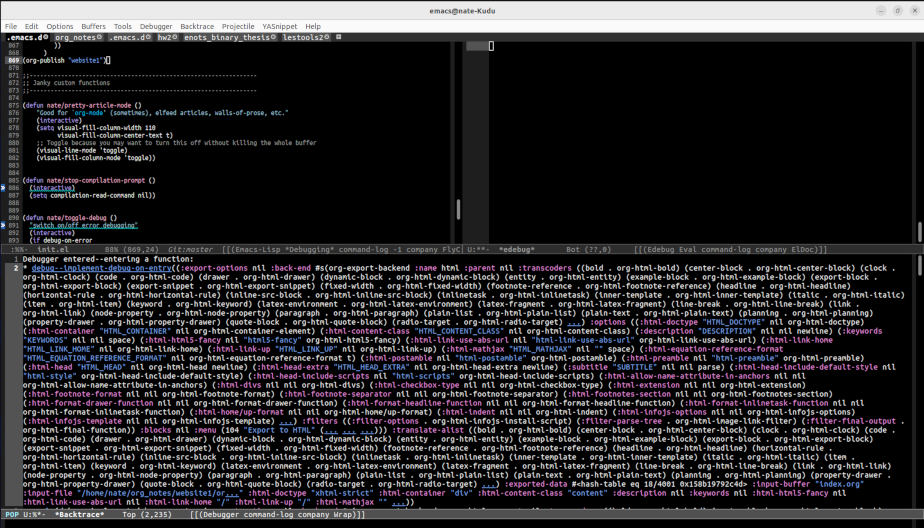
Here's a tip for dealing with backtraces that look like this:

Figure 1: unreadable backtrace
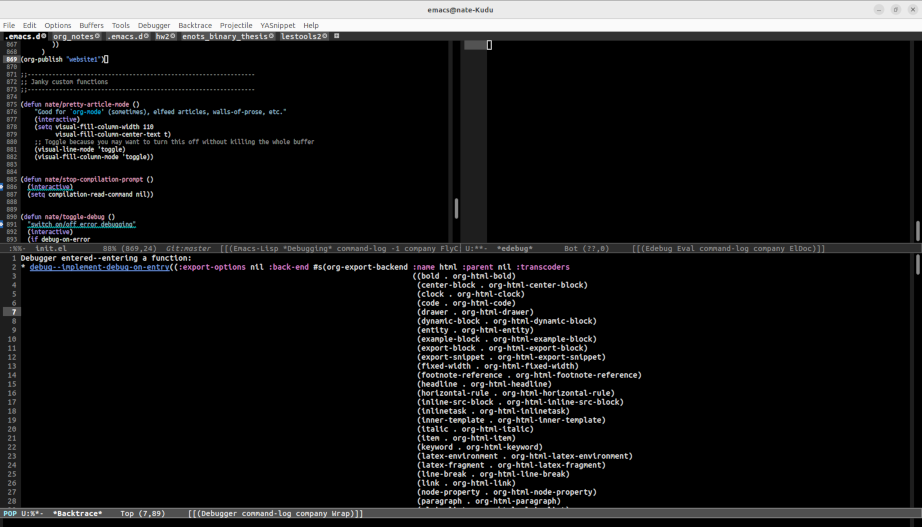
You can tap + to pretty-print:

Figure 2: Formatted backtrace